Hey Traders!
You know the old adage, “Show me a card, any card”? Well, I do NOT want to make any false claims or mislead in any way with my blogs. I would like to avoid all smoke and mirrors, so on that note, please send Peter or Mark an email off of the Inteligex website, and let’s try something new and different. You tell US what markets YOU want to see the software on, what timeframe, and which day. I will then set up a chart and show you all the trades for that morning session. (I don’t trade the afternoon session, as I prefer the volatility in the morning and find it dries up after noon est)
This week I thought I would experiment and show you Crude Oil on a 5 minute chart.
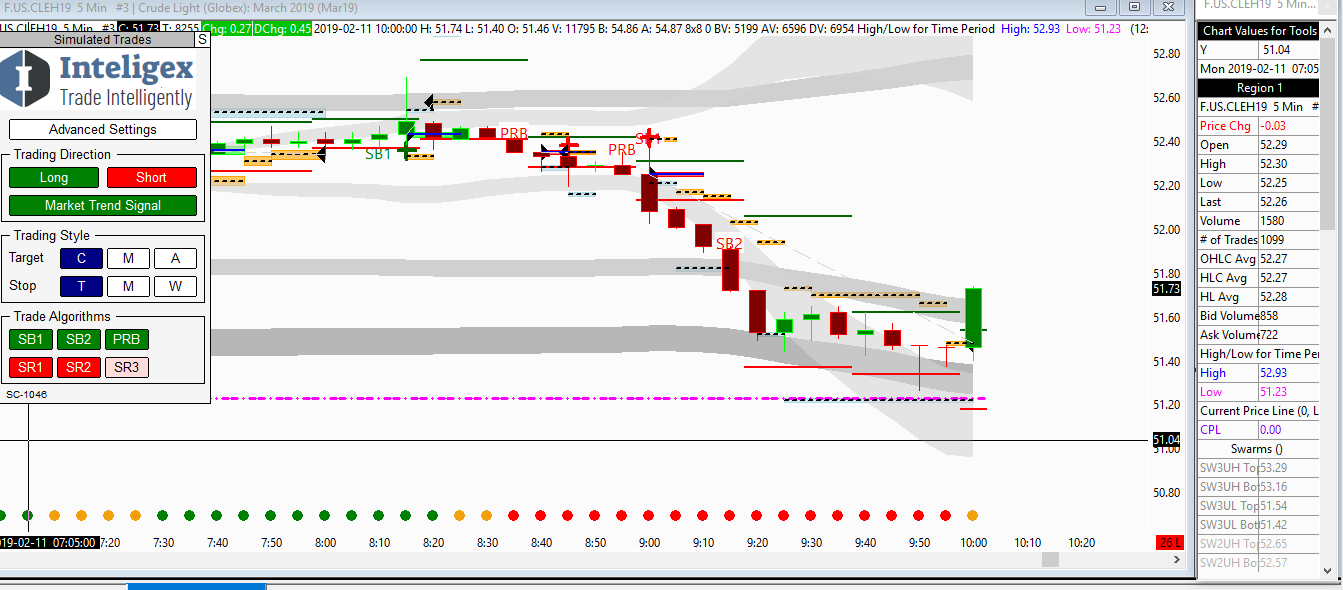
First trade was Monday, February 11th. I have left the Market Trend Signal on, so no guessing – software will only show me trades with the underlying trend. A short triggered at 8:55 am, and I entered at 9 am at $52.25. You can see it trailed all the way down and I got out at $51.48. That’s a profit of 77 ticks ($770 per contract).
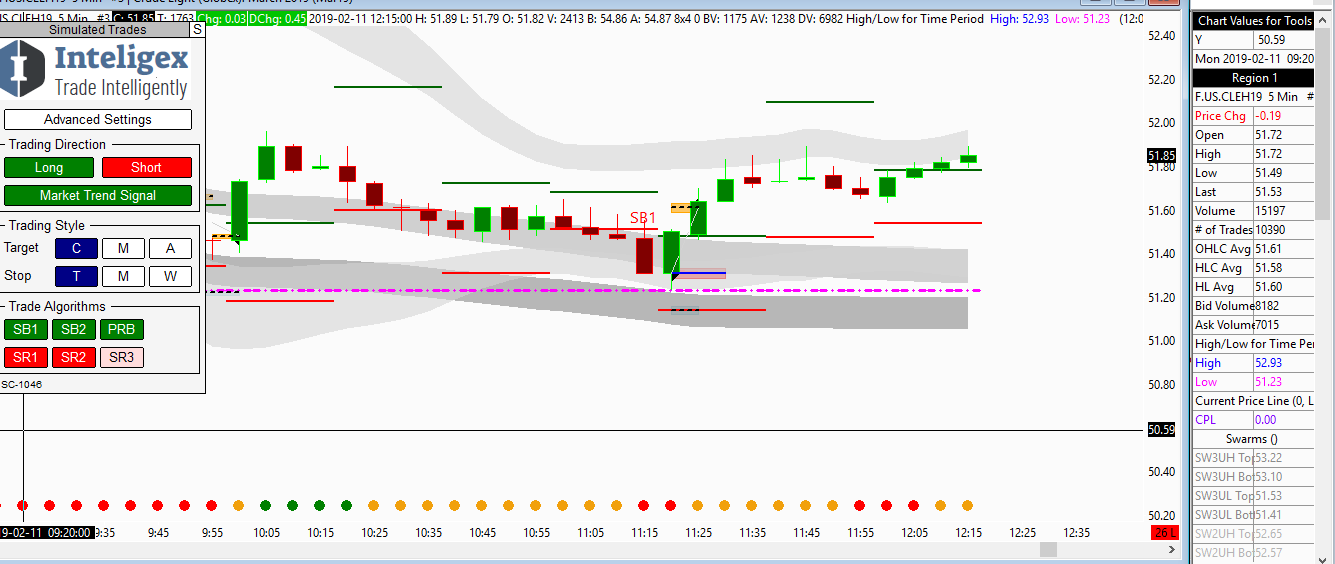
Second short triggered at 11:15, so at 11:20 I entered at $51.31 – stopped out at $51.61 (loss of $300 per contract). That left me with a pnl of $470 for the morning. Not bad for a couple of hours work!

Tuesday, February 12th same drill. I took a short entry at 10:20; filled at $53.51 and out at $53.30 for a profit of $210 per contract.

So now the ball is in your court, traders. What do you want to see the software on next week?
Trade well.
Pam S.

